Cerro de Pasco Resources Successfully Completes First Full Year of Production
May 1, 2023
CDPR Reports Fourth Quarter and Full Year Results and Provides 2023 Guidance
MONTRÉAL, QUÉBEC, CANADA / May 1, 2023/ Cerro de Pasco Resources Inc. (CSE: CDPR) (OTCPK: GPPRF) (Frankfurt: N8HP) (“CDPR,” or the “Company”) is pleased to announce selected financial information and production results for the fourth quarter and year ended December 31, 2022. The Company’s consolidated financial statements for the year ended December 31, 2022, and Management Discussion and Analysis (“MD&A”) thereon can be viewed under the Company’s profile at www.sedar.com. Production results are from the Company’s wholly owned Santander Mine (“Santander”), located in Peru. All amounts are in U.S. dollars, unless otherwise noted.
2022 Highlights
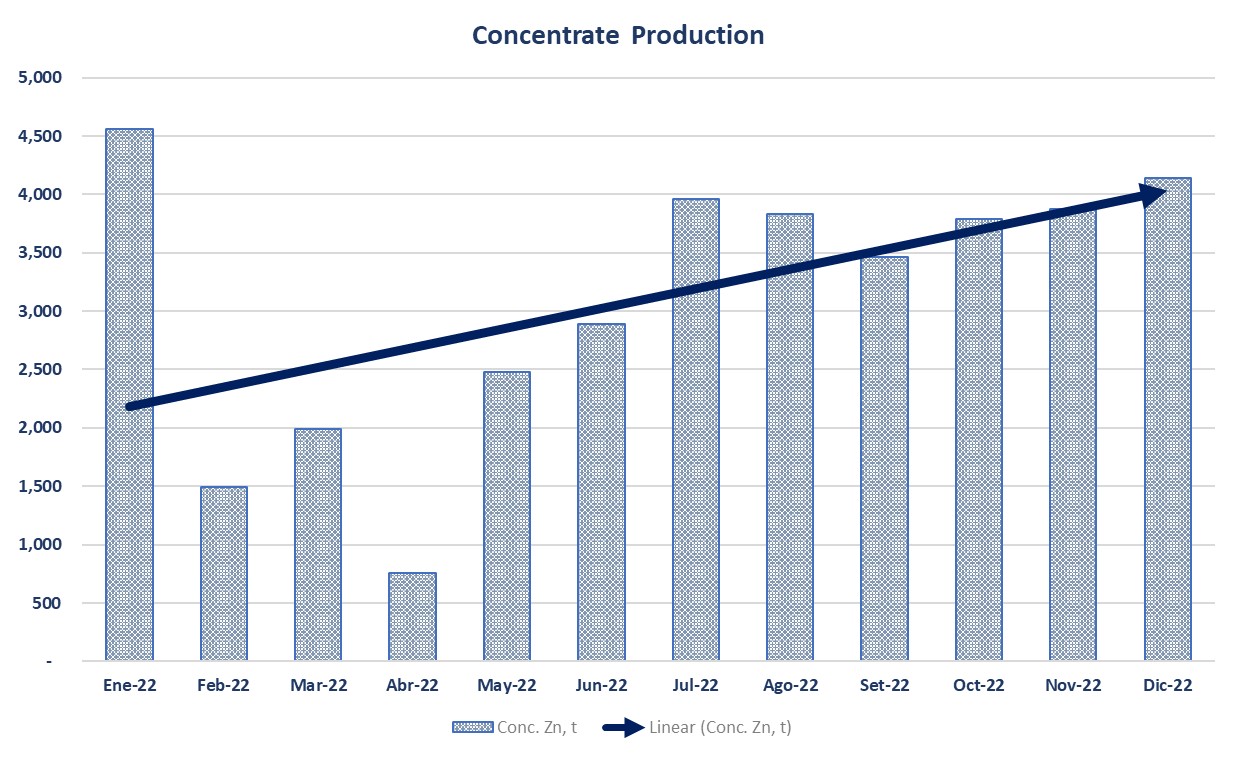
- Production for 2022 was 32.7 million pounds of zinc, 1.94 million pounds of lead, and 120,000 ounces of silver.
- Revenue for 2022 of $40.6M on payable production of 31.7 million pounds of zinc, 1.58 million pounds of lead, and 120,00 ounces of silver
- Achieved lower end of full year production guidance in payable zinc and lead while meeting upper end of cost guidance.
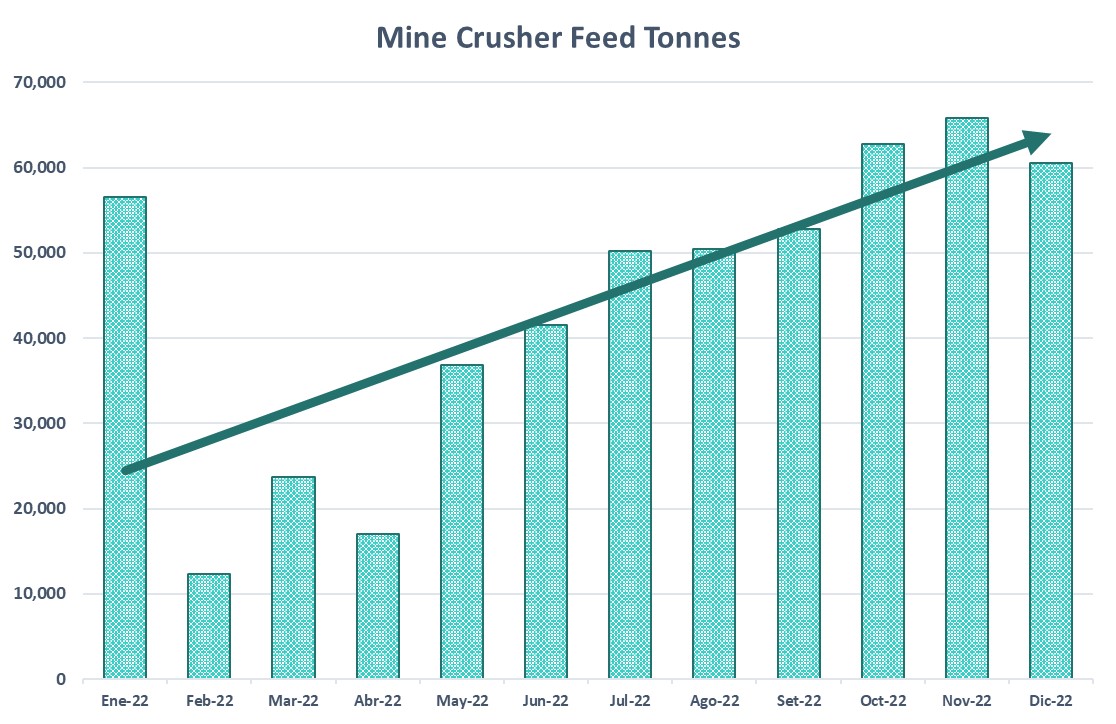
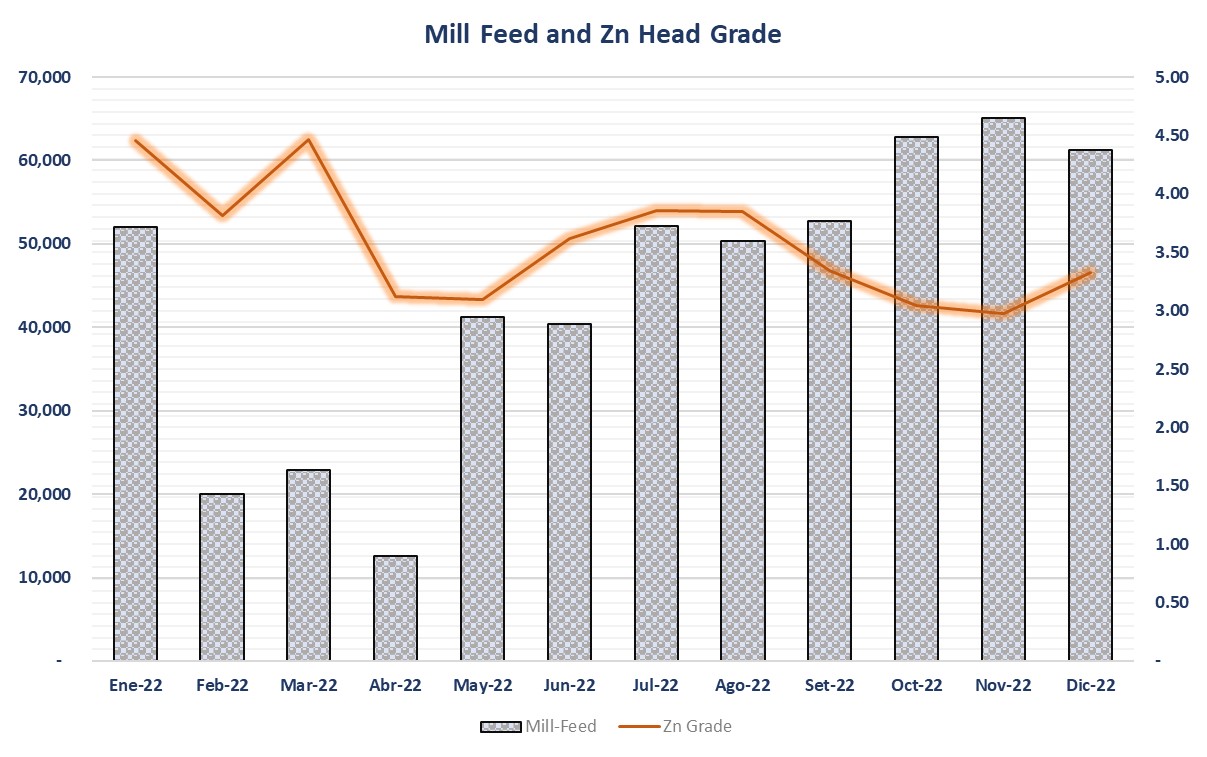
- Achieved 2022 target goals to stabilize and ramp-up the operations, starting from 12 thousand tonnes milled in April to 63 thousand tonnes average in Q4 2022.
- 2022 C1 cash cost (4) of $1.62, and AISC (5) $1.81 per pound of zinc produced remain in-line with the Company’s projections; AISC was influenced in 2022 by significant capital expenditures including, exploration, production ramp-up, pumping & power infrastructure, and development in preparation for Pipe production.
- Achieved a total inventory of 240,000 tonnes of ore developed, or a total of 4 months of production. In April 2022 this number was less than 20,000 tonnes.
- Positive mine operating cash flow (3) of over $8.5 million.
- Over 80% of the net loss for 2022 comprises either non-cash or one-time items (6); net loss for the year totaled $18.1M.
- As of December 31, 2022, the Company had cash, cash equivalents, and restricted cash of $5.5 million.
Q4 2022 Highlights
- Production in Q4 2022 was 10.1 million pounds of zinc, 440 thousand pounds of lead, and 34.4 thousand ounces of silver.
- Revenue for Q4 2022 was $9.9 million on payable production of 9.6 million pounds of zinc, 180,000 thousand pounds of lead, and 34.4 thousand ounces of silver.
- C1 cash cost (4) per pound of zinc produced in Q4 2022 was $1.46.
- Total All-in sustaining cost (“AISC”) (5) per pound of zinc produced in Q4 2022 was $1.68.
- Net loss for Q4 2022 was $9.9 million or ($0.03) per share.
- Santander mine operating cash flow (3) for Q4 2022 was positive $9.2 million.
- Q4 2022 average mill production was 2,100 tonnes per day. This was a 19.6% improvement over throughput achieved in Q3 2022. This is the highest quarterly production average since 2020.
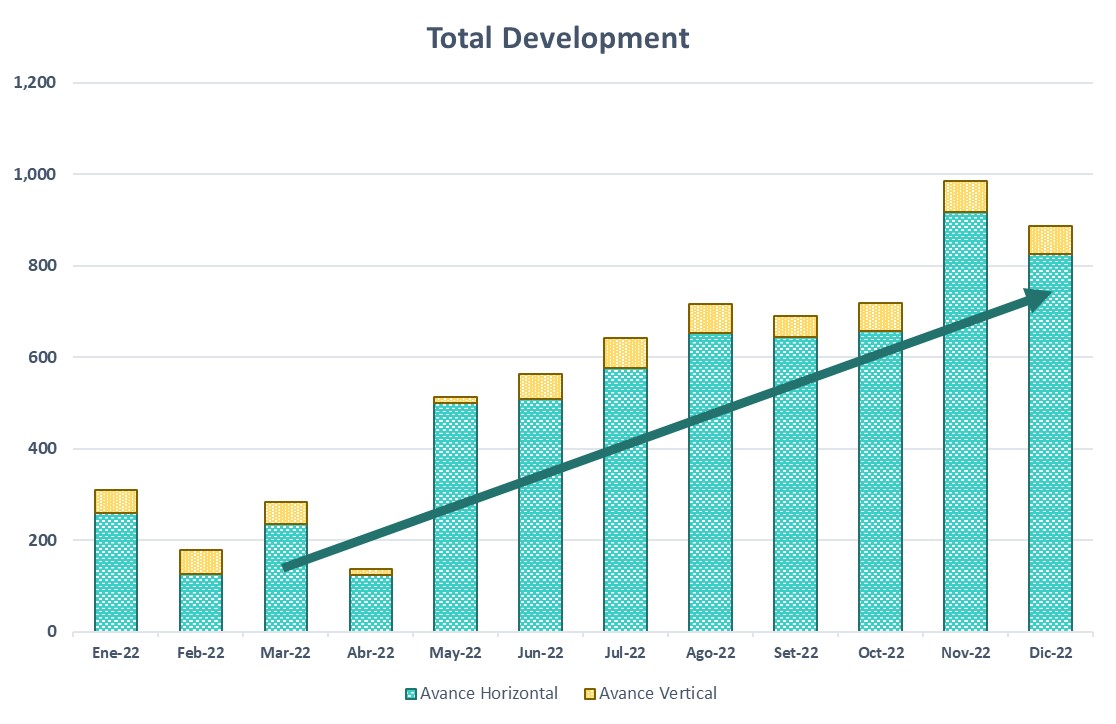
- Average mine development of 850 meters per month for Q4 2022. November achieved 920 meters, a record for 2022 and the highest since 2020.
- Subsequent to quarter-end:
- On January 18, 2023, the Company announced that it has been granted by INGEMMET three additional mining concessions adjacent to its Santander Mine. The new concessions cover an additional 2,094.103 ha.
- On February 21, 2023, the Company announced the results of Preliminary Economic Assessment (“PEA”) for its brownfield Pipe Project (“the Project” or “the Santander Pipe”).
- On February 22, 2023, the Company announced the extension of the surface right contract between CDPR and the community of Quiulacocha for the first phase of the Quiulacocha Tailings Project.
- On March 7, 2023, the Company announced that the Quiulacocha Tailings Reprocessing Project is included in the 2023 Ministry of Economy and Finance (MEF) Specialized Projects List for the Promotion of Investment.
- On March 21, 2023, the Company announced that signed a Memorandum of Understanding Volcan Compania Minera S.A.A., setting out shared objectives and a framework for collaboration with regards to first phase of development and exploration of CDPR's Quiulacocha Tailings Project. In addition, the Company announced that Glencore International AG will provide CDPR a $2 Million term loan to cover the costs associated with the first phase of the QT Project
- On April 4, 2023, the Company announced the closing of a CA$2,519,500 private placement.
Guy Goulet, CDPR’s CEO commented, “In the fourth quarter, we achieved our year-end goal to stabilize operations at the Santander mine by delivering strong operating performance and meeting our full year 2022 Guidance. Our committed investment in the operation has transformed Santander from an operation that was expected to wind-down in March of 2022, to a future multi-year operation.”
Jorge Lozano, CDPR's COO commented “In 2023, our focus is to continue to establish our operations track record, fast-track our cost optimization plans and construction of key infrastructure projects necessary for the Pipe project which we believe will unlock the full value of the Santander mine. Following the independent validation demonstrated in our PEA Study on the Santander Pipe, the Company is in advanced discussions with different institutions and is confident in its ability to finance the project.”
Summary of Operating Results at Santander
| Q1' 22 | Q2' 22 | Q3' 22 | Q4' 22 | Full Year | ||
| Production | ||||||
| Ore Mined | t | 92,602 | 95,277 | 153,527 | 189,139 | 530,545 |
| Ore Milled | t | 94,918 | 94,207 | 155,270 | 189,167 | 533,562 |
| Zn Head Grade | % | 4.30 | 3.30 | 3.70 | 3.11 | 3.53 |
| Pb Head Grade | % | 0.20 | 0.30 | 0.20 | 0.18 | 0.22 |
| Ag Head Grade | oz/t | 0.56 | 0.50 | 0.44 | 0.49 | 0.48 |
| Zn Recovery | % | 95.30 | 94.80 | 94.00 | 94.50 | 94.59 |
| Pb Recovery | % | 75.10 | 71.10 | 70.70 | 61.43 | 68.84 |
| Ag recovery | % | 50.30 | 47.30 | 47.10 | 38.76 | 44.65 |
| Zn Payable Production | Mlbs | 7.20 | 5.50 | 9.90 | 10.10 | 32.70 |
| Pb Payable Production | Mlbs | 0.30 | 0.40 | 0.80 | 0.44 | 1.94 |
| Ag Payable Production | Moz | 0.02 | 0.02 | 0.05 | 0.03 | 0.12 |
| Zn Head Grade | % | 48.70 | 48.40 | 47.70 | 47.15 | 47.87 |
| Pb Head Grade | % | 48.50 | 50.50 | 50.30 | 51.60 | 50.35 |
| Sales | ||||||
| Zn Payable sold | Mlbs | 7.50 | 4.90 | 9.70 | 9.60 | 31.70 |
| Pb Payable sold | Mlbs | 0.20 | 0.40 | 0.80 | 0.18 | 1.58 |
| Ag Payable sold | Moz | 0.02 | 0.02 | 0.05 | 0.03 | 0.12 |
| Finance | ||||||
| Revenues, net | (000)s $ | 14,581 | 6,891 | 9,221 | 9,898 | 40,591 |
| Cost of Goods Sold | (000)s $ | -9,725 | -8,327 | -10,431 | -12,562 | -41,045 |
| Gross Profit | (000)s $ | 4,856 | -1,436 | -1,210 | -2,664 | -454 |
| Sales and Admin Expenses | (000s) $ | -584 | -689 | -638 | -681 | -2,592 |
| Adjusted EBITDA(w) | (000)s $ | 4,272 | -2,125 | -1,848 | -3,345 | -3,046 |
| Other income (expense) | -18 | -898 | -75 | -5,459 | -6,450 | |
| EBITDA (1) | (000)s $ | 4,254 | -3,023 | -1,923 | -5,794 | -6,486 |
| Depreciation | (000)s $ | 262 | 265 | 542 | 493 | 1,562 |
| EBIT (1) | (000)s $ | 4,516 | -2,758 | -1,381 | -5,301 | -4,924 |
| Q1' 22 | Q2' 22 | Q3' 22 | Q4' 22 | Full Year | ||
| Mine Operating Expenses | (000)s $ | 9,517 | 10,390 | 11,369 | 11,334 | 42,610 |
| Smelting and refining | (000)s $ | 2,459 | 1,990 | 4,157 | 4,103 | 12,709 |
| Distribution | (000)s $ | 217 | 180 | 315 | 304 | 1,016 |
| Royalties | (000)s $ | 27 | 25 | 62 | 29 | 143 |
| Less: By-product revenues | (000)s $ | -678 | -717 | -996 | -991 | -3,382 |
| C1 total costs(4) | (000)s $ | 11,542 | 11,868 | 14,907 | 14,779 | 53,096 |
| Sustaining CAPEX | (000)s $ | 198 | 1,235 | 2,533 | 2,155 | 6,121 |
| Lease Payments | (000)s $ | 0 | 0 | 0 | 0 | 0 |
| AISC total costs(5) | (000)s $ | 11,740 | 13,103 | 17,440 | 16,934 | 59,217 |
| Pounds of zinc payable produced | Mlbs | 7.2 | 5.5 | 9.9 | 10.1 | 32.7 |
| C1 Cash Cost (4) per pound | $ | 1.60 | 2.16 | 1.51 | 1.46 | 1.62 |
| All-in Sustaining Cost per pound(5) | $ | 1.60 | 2.38 | 1.76 | 1.68 | 1.81 |
2022 Santander Development and Exploration Highlights
- Completed phase-1 equipment reconditioning program.
- Support equipment overhaul is 100% complete.
- Shotcrete fleet is 100% new.
- Scooptram loaders overhaul at 50%.
- Scaler´s overhaul is 100% complete.
- Mining-trucks fleet overhaul is 100% complete.
- Production drills overhaul (Simba´s) 50% competed and face drilling (Jumbo´s) at 33%.
- Optimization of grinding circuit at processing plant (ore target: 70% ore passing 200 mesh) and operating controls in the concentrator plant resulted in:
- Achieving recoveries above 90% for Zinc
- Average concentrate quality for Zinc of 48%
- Average concentrate quality for Lead of 50%
- Average moisture in concentrates of 8.5% or under.
- Executed $ 4.1 million in extensive exploration drilling campaign and project studies resulting on:
- Discovery of Pipe North Extension
- Definition of Santander Pipe resource
- Increased resources at Magistral
- Increased potential at targets: Puajanca & Blanquita
- Update on NI 43-101 Model Resource Estimate (MRE) on Magistral
- New NI 43-101 Model Resource Estimate (MRE) on Santander Pipe
- New NI 43-101 PEA on Santander Pipe (Jan-2023)
Santander Mineral Resource Inventory
Magistral
The Mineral Resources Inventory for the Magistral Mine was declared in CDPR´s technical Report NI 43-101 by DRA Global in 2021. This report was updated in 2022 by DRA Global-Information Memorandum Report as of the 9th of September of 2022.:
| Magistral Mineral Resources | |||||
| Category | Tonnage (kt) | Zn (%) | Pb (%) | Ag (g/t) | Cu (%) |
| Measured | 666 | 4.29 | 0.33 | 19.5 | 0.05 |
| Indicated | 1,789 | 3.99 | 0.18 | 18.1 | 0.06 |
| Measured + Indicated | 2,454 | 4.07 | 0.22 | 18.5 | 0.06 |
| Inferred | 1,248 | 3.52 | 0.12 | 16.1 | 0.06 |
- All Mineral Resources have been estimated in accordance with the CIM Definition Standards. Mineral Resources that are not Mineral Reserves do not have demonstrated economic viability.
- The Magistral Underground Mine Mineral Resource estimate is reported based on a net smelter return cut-off grade of $40/tonne with metal prices of: $3,000/tonne for Zn, $2,200/tonne for Pb, and $ 25/Oz for Ag.
- For Magistral: NSR = (16.7 x %Zn) + (11.9 x %Pb) + (0.41 x g/tAg), assuming recoveries of 90% for Zn, 75% for Pb and 55% for Ag.
- The mine Geology Department has prepared the Santander Magistral Underground Mine Mineral Resource model. Qualified Person, Mr. Graeme Lyall (FAusIMM), DRA independent Resource geology consultant, has validated the resource with adjustments effective September 09, 2022.
Santander Pipe
The Mineral Resources Inventory for the Pipe Project effective date of the report declared in Preliminary Economic Assessment (DRA, 2023) as of the 31st of January of 2023:
| Pipe Project Mineral Resources | |||||
| Category | Tonnage (kt) | Zn (%) | Pb (%) | Ag (g/t) | Cu (%) |
| Measured | - | - | - | - | - |
| Indicated | 3,225 | 6.94 | 0.017 | 13.5 | 0.17 |
| Measured + Indicated | 3,225 | 6.94 | 0.017 | 13.5 | 0.17 |
| Inferred | 1,779 | 5.95 | 0.013 | 7.9 | 0.15 |
- All Mineral Resources have been estimated in accordance with the CIM Definition Standards. Mineral Resources that are not Mineral Reserves do not have demonstrated economic viability.
- The Santander Pipe Underground Deposit Mineral Resource estimate is reported based on net smelter return cut-off grade of $40/tonne with metal prices of $3,000/tonne for Zn, $2,200/tonne for Pb, $9,300/tonne for Cu, and $25/Oz for Ag.
- For Santander Pipe: NSR = (17.5 x %Zn) + (11.1 x %Pb) + (40.8 x %Cu) + (0.37 x g/tAg), assuming recoveries of 90% for Zn, 70% for Pb, 60% for Cu and 50% for Ag.
- The mine Geology Department has prepared the Santander Pipe Underground Deposit Mineral Resource Model. Qualified Person, Mr. Graeme Lyall (FAusIMM), DRA independent Resource geology consultant, has validated the resource with adjustments effective January 31, 2023.
2023 Production Guidance & Outlook
| Units | Guidance 2023 | |
| Payable production of ZnEq* | (000)s lbs | 41,661 – 55,365 |
| Payable production of Zinc | (000)s lbs | 39,182 – 52,071 |
| Payable production of Lead | (000)s lbs | 1,284 – 1,707 |
| Payable production of Silver | (000)s oz | 106 – 141 |
| C1 Cost | $/lb Zn | 1.55 – 1.41 |
| AISC Cost | $/lb Zn | 2.20 – 2.00 |
| Concentrate Zinc | dmt | 39,926 – 50,494 |
- Cash Costs calculated on a by-product basis measured in zinc equivalent unit pounds. Zinc equivalent calculated by converting by-product lead and silver units equivalent to a Zinc unit by proportionally weighted unit value of by-product to the price value of each metal.
- AISC costs reflect the sustaining capex required at Santander, such as tailings expansion, pumping & power infrastructure, and development in preparation for Pipe production.
- Prices considered are $1.51/lb for zinc, $1.01/lb for lead and $23/oz for silver.
The Santander Advantage
The operating assets that Cerro de Pasco Resources owns at the Santander mine are held on the books for approximately $9.1M having been discounted when the former operator looked to close down the operation. As the Company works to expand the mine life and resources at Santander, it will enjoy a significant production advantage due to the potential replacement value of its operating assets and therefore avoid capex associated with building a new mill. The assets are in first-class condition and include a 2,500 tonne per day sulfide milling and flotation plant originally commissioned in 2013, as well as buildings, communications equipment, underground infrastructure, support facilities, furniture, fixtures and other equipment. Likewise, social licenses as well as operating permits are, for the most part, already in place for future brownfield expansions.
Positive Preliminary Economic Assessment for the Santander Mine
- On February 21, 2023, the Company announced the results of Preliminary Economic Assessment (“PEA”) for its brownfield Pipe Project (“the Project” or “the Santander Pipe”). The Project forms a strategic cornerstone for CDPR’s 100% owned Santander Mine, located in central Peru.
- The Santander Pipe demonstrates positive financial returns, with a pre-tax net present value (“NPV”) at 6% discount rate of $ 71.3 million, generating an estimated internal rate of return (“IRR”) of 46.6%.
- The PEA considers the Project as a standalone operation with zinc concentrate production estimated at 313,600 dry metric tonnes (“dmt”) over a 5-year schedule.
- Project cash cost (“C1”) and all-in sustaining cost (“AISC”) of $ 0.82/lb Zn and $ 1.05/lb Zn, respectively, generating revenues of $ 388.6 million and pre-tax free cash flow of $ 99.6 million.
- Considered in the Project are synergies to be realized from the existing 2,500 tpd sulfide concentrator, electrical power grid, pumping station, water treatment plant, tailings facility, and other infrastructure from the existing Santander Magistral operation. Current on-going Magistral operation—mining and ore processing—is not considered in the PEA study.
- The mineral resource estimate (“MRE”) to be mined considers Indicated Mineral Resource of 3.23 Mt with 6.94% Zn and Inferred Mineral Resource of 1.78 Mt with 5.95% Zn; while the industrial circuit plans to process an average of 770,000t of mineralized material per year (with peak production at 900,000 tonnes year), with an average grade of 4.7% of Zn, 89% recovery and 51% in Zn concentrate grade.
- The Project is also set to benefit from significant potential resources, such as the Santander Pipe mineralization above the 4020 level, estimated to contain some 3 to 4 million tonnes averaging 4 to 6% Zn, and the newly discovered Pipe North zone.
Consolidated Mine Plan
- The Company’s overall consolidated mine plan for the Santander operation consists of further development of its current Magistral operation and developing the Santander Pipe as outlined in Santander Pipe PEA study. In addition, the Company will also be looking to develop the potential areas as outlined in the PEA study, the Pipe´s Upper Zone and North Extension.
- The Upper-Zone is considered potential because the depletion solid (previously mined material) could not be verified as the mined area is currently flooded. The Upper-Zone has more than 44% more drilling density than Main Santander Pipe which is where the PEA focused. The actual potential resource of The Upper-Zone is: 3-4 M tonnes at 5-6%+ Zn. Historically, the mine operated under a 9% Zn grade cutoff, offering the opportunity to high-grade un-mined areas as well as recover high grade stope and pillars left over from the historic operation.
- The Pipe North Extension was discovered by the Company last year and it’s an exciting potential zone. CDPR´s has budgeted over 15,000m of underground drilling in 2023 and expects to produce an updated mineral resource estimate by early 2024.
- The Company’s non-NI43-101 compliant consolidated budget plan envisages mining over 10Mt at 4.4% Zn producing 1.1Mt Zn, 15kt Pb and 49kt Cu of concentrate, representing ~560,000kt of payable ZnEq over 13 years at $ 1.00/lb AISC.
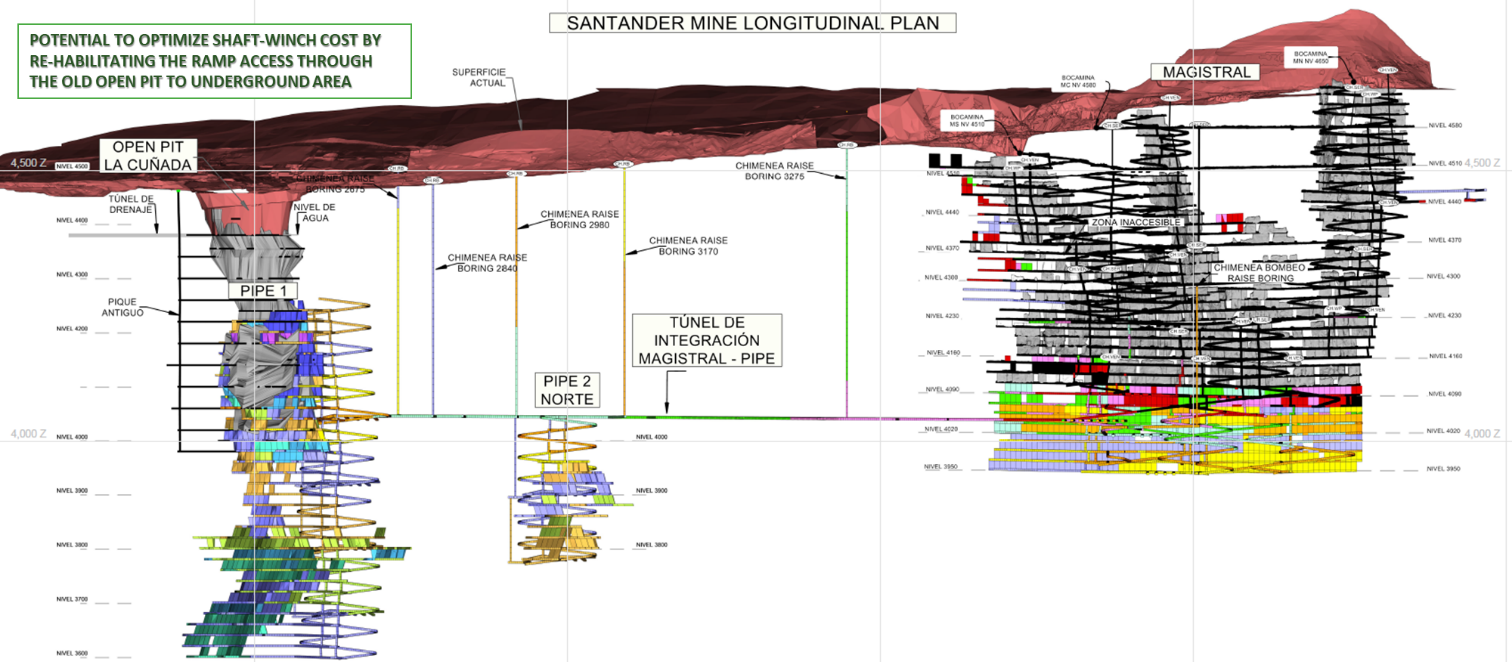
(Sources CDPR Corporate Presentation March2023)
2023 Santander Outlook
- 2023 marks the start of the consolidation and expansion phase for the Santander mine, as it ramps up construction of several projects related to the Santander Pipe project.
- The Company´s goal is to develop a muti-deposit operation as considered in its own consolidated model, as described on the company website, it utilizes the Magistral and all other available mineral sources outlined in the PEA report.
- The Company plans to invest over $30 million in capital expenditures over the next 2 years, including $22 million for development of the Santander Pipe project, $9 million for new infrastructure and $3 million in exploration.
- The highlights of an independent 43-101 PEA report were reported in a Company press release dated February 21st, 2023.
- Projects for Santander Pipe include detailed engineering, permitting, as well as preliminary construction activities related to the Santander Pipe project and water treatment capacity.
- Optimize OPEX by procuring a new partial production fleet and optimizing equipment cost and availability.
- Complete targeted construction of an exploration tunnel from Magistral to the Pipe North Extension. Tunnel is expected to be completed by early Q2 2024 when it reaches the Main Santander Pipe area.
- Complete an underground drilling campaign of the Santander Pipe and Pipe North Extension.
- Initiate and complete surface drilling campaign for Puajanca and Naty exploration targets and define the potential MRE zone.
- Produce an updated NI 43-101 mineral resource statement.
- Further strengthen the balance sheet through obtainment of project financing and working capital.
Corporate objectives for 2023
- Complete Drilling Campaign for Quiulaocha Tailings Project
- Obtain land access agreement (rights of passage) for permission to access the surface land which underlays the El Metalurgista concession
- Obtain Peruvian Government assignment of responsibility to restore and remediate the entire area of the Quiulacocha Tailings and Excelsior stockpile.
- Produce a Resource Estimate on Quiulaochca Tailings
- Complete Geophyscial, Minerolgoical and Metallurgical studies on the Quiulacocha Tailings.
- Advance towards the Santander Pipe.
- Explore and identify for new and additional resource potential at Santander with the focus on a 10 year plus life of mine
- Advance H2-Sphere’s Research and Development on converting mine waste into green hydrogen and other by-products
- Strengthen balance sheet
Technical Information
Mr. Jorge Lozano, MMSAQP and Chief Operating Officer for CDPR, has reviewed and approved the scientific and technical information contained in this news release. Mr. Lozano is a Qualified Person for the purposes of reporting in compliance with NI 43-101.
About Cerro de Pasco Resources
Cerro de Pasco Resources Inc. is a mining and resource management company with unparalleled knowledge of the mineral endowment in the city of Cerro de Pasco and its surroundings. Initially, the Company will unlock the useful life of the mine and extend the concession areas in its Santander mining operation, applying the highest safety, environmental, social and governance standards. The key focus of the growth for the Company is on the development of the El Metalurgista mining concession, one of the world's largest surface mineralized resources, applying the latest techniques and innovative solutions to process tailings, extract metals and convert the remaining waste into green hydrogen and derivatives.
Contact Information
Cerro de Pasco Resources Inc.
Guy Goulet, CEO
Tel.: 579 476-7000
Email: ggoulet@pascoresources.com
Forward-Looking Statements and Disclaimer
Certain information contained herein may constitute “forward-looking information” or “forward-looking statements” under Canadian securities legislation. Generally, forward-looking information can be identified by words such as "pro forma", "plans", "expects", "may", "should", "could", "will", "budget", "scheduled", "estimates", "forecasts", "intends", "anticipates", "believes", or variations including negative variations thereof of such words and phrases that refer to certain actions, events or results that may, occur or be taken or achieved. Such forward-looking statements, including but not limited to statements relating to the expected development and operations of the Company and H2-SPHERE, involve risks, uncertainties and other factors which may cause the actual results to be materially different from those expressed or implied by such forward-looking statements or forward-looking information. Such factors include, among others, risks related to the exploration, development and mining operations; impacts of macroeconomic developments as well as the impact of the COVID-19 pandemic; and any material adverse effect on the business, properties and assets of the Company or H2-SPHERE. There can be no assurance that such statements will prove to be accurate, as actual results and future events could differ materially from those anticipated in such statements. Accordingly, readers should not place undue reliance on forward-looking statements and forward-looking information. The Company will not update any forward-looking statements or forward-looking information included herein, except as required by applicable securities laws.
Cautionary Note Regarding Non-IFRS Financial Performance Measures
This MD&A refers to the following non-IFRS financial performance measures: Earnings before interest, taxes, depreciation and amortization (“EBITDA”), Earnings before interest and taxes (“EBIT”), Adjusted EBITDA, Adjusted EBIT, Adjusted Earnings per Share, Net Debt, C1 Cash Cost and All-In Sustaining Cost (“AISC”).
These measures are not recognized under IFRS as they do not have any standardized meaning prescribed by IFRS and are therefore unlikely to be comparable to similar measures presented by other issuers. CDPR uses these measures internally to evaluate the underlying operating performance of the Company for the reporting periods presented. The use of these measures enables the Company to assess performance trends and to evaluate the results of the underlying business. CDPR understands that certain investors, and others who follow the Company’s performance, also assess performance in this way.
The Company believes that these metrics measure our performance and are useful indicators of our expected performance in future periods. This data is intended to provide additional information and should not be considered in isolation or as a substitute for measures of performance prepared in accordance with IFRS.
- EBITDA and EBIT
EBITDA provides insight into overall business performance. This measure assists readers in understanding the ongoing cash generating potential of the business including liquidity to fund working capital, service debt, and fund capital expenditures and investment opportunities. EBITDA is profit attributable to shareholders before net finance expense, income taxes and depreciation, depletion, and amortization. EBIT is EBITDA after depreciation, depletion, and amortization. Other companies may calculate EBIT and EBITDA differently.
- Adjusted EBITDA, Adjusted EBIT and Adjusted Earnings per Share
Adjusted EBITDA consists of EBITDA less the impact of impairments or reversals of impairment and other non-cash and non-recurring expenses and recoveries. Adjusted EBIT consists of EBIT less the impact of impairments or reversals of impairment and other non-cash and non-recurring expenses and recoveries. These expenses and recoveries are removed from the calculation of EBITDA and EBIT as the Company does not believe they are reflective of the Company's ability to generate liquidity and its core operating results.
Adjusted Earnings per Share consists of net income or loss in the period less the impact of impairments or reversals of impairment, settlement mark-to-market, fair value (gain) loss on financial instruments, (gain) loss on foreign exchange, restructuring expenses and other income or expenses.
- Mine Operating Cash Flow
Mine operating Cash Flow is net income from operations adding back the net effects of changes in impairment, tax provisions, tax accruals, depreciation and amortization, non-cash changes in working capital and changes due to non-cash purchase price allocation adjustments.
- C1 Cash Cost
This measures the estimated cash cost to produce a pound of payable zinc. This measure includes mine operating production expenses such as mining, processing, administration, indirect charges (including surface maintenance and camp), and smelting, refining and freight, distribution, royalties, and by-product metal revenues divided by pounds of payable zinc produced. C1 Cash Cost per pound of payable zinc produced does not include depreciation, depletion, and amortization, reclamation expenses, capital sustaining and exploration expenses.
- AISC
This measures the estimated cash costs to produce a pound of payable zinc plus the estimated capital sustaining costs to maintain the mine and mill. This measure includes the C1 Cash Cost per pound and capital sustaining costs divided by pounds of payable zinc produced. All-In Sustaining Cost per pound of zinc payable produced does not include depreciation, depletion, and amortization, reclamation, and exploration expenses.
- Non-cash or one-time items
Non-cash or one-time items include depreciation, stock-based compensation, loss or gain on derivatives, change of fair value on contingent payments and other financial assets, losses on the dissolution of subsidiaries, provisions for contingent taxes, gain on the extinguishment of debt and presumed interest on convertible and promissory notes.
Interviews
Guy Goulet of Cerro de Pasco Resources Inc. talks to Chen Lin at the Sept Metals Investor Forum
Crux Investor | Cerro de Pasco (TSXV:CDPR) - All Known Questions Answered
Guy Goulet of Cerro de Pasco Resources presents at Metals Investor Forum in Vancouver
Guy Goulet of Cerro de Pasco Resources Inc. talks to Chen Lin at the May Metals Investor Forum
Crux Investor | Cerro de Pasco (CSE:CDPR) - Advancing The World's Largest Above Ground Mineral Resource
Guy Goulet of Cerro de Pasco Resources talks to Peter Krauth at Metals Investor Forum
Guy Goulet of Cerro de Pasco Resources talks to Brien Lundin at Metals Investor Forum
Guy Goulet of Cerro de Pasco Resources talks to Chen Lin at Metals Investor Forum
Discussing the latest drill results from the Quiulacocha Tailings Project with Chen Lin
Interview with Arne Lutsch (Battery Commodity) and Guy Goulet on November, 2024
The fast track to revitalising history’s most prolific mine in Peru | $CDPR

